🌬️ WindPulse
Heat Map-Based Clustered Diurnal Wind Power Density Analysis for Optimized Maintenance Scheduling of Wind Farms in India
WindPulse is an advanced analytics platform that leverages heat map visualizations and clustering algorithms on diurnal wind patterns to enable data-driven maintenance planning for Indian wind farms — maximizing uptime and energy production efficiency.
📊 Key Results
✨ Key Features
📈 Diurnal Wind Pattern Analysis
Comprehensive analysis of hourly wind power density patterns throughout 24-hour cycles across all seasons.
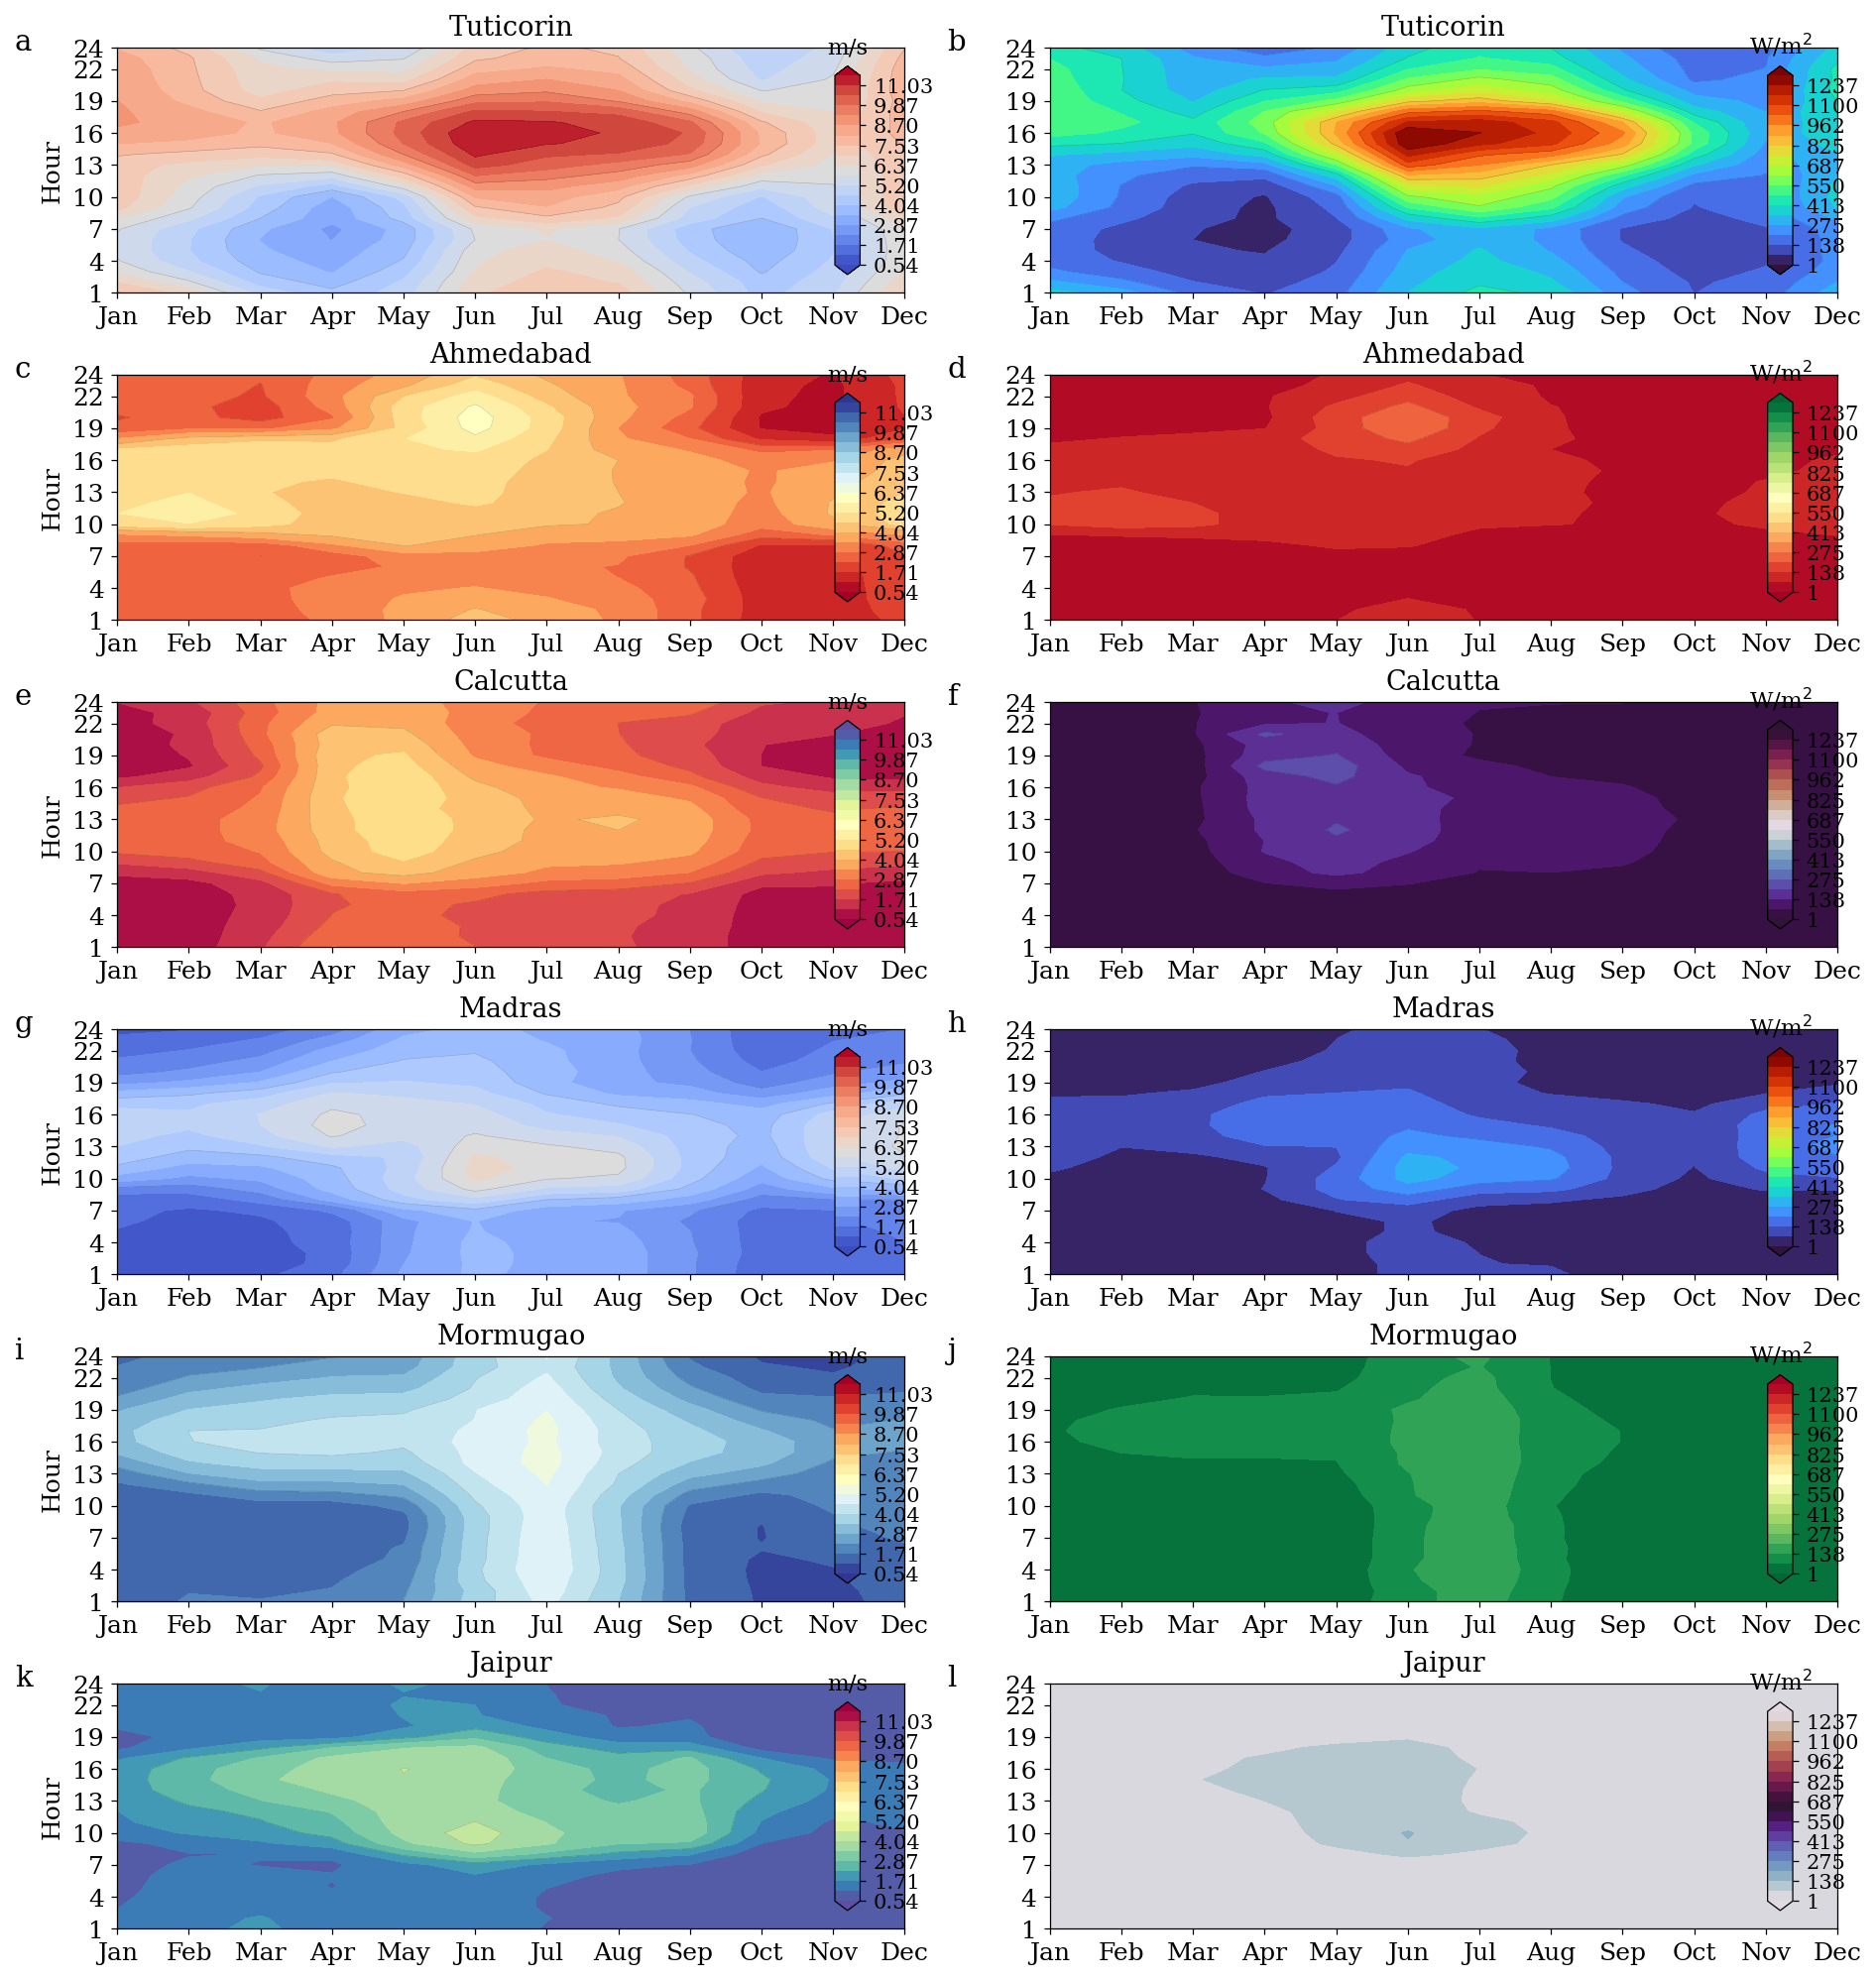
🗺️ Heat Map Visualization
Intuitive color-coded contour representations of wind power density across time and location.
🤖 ML Clustering
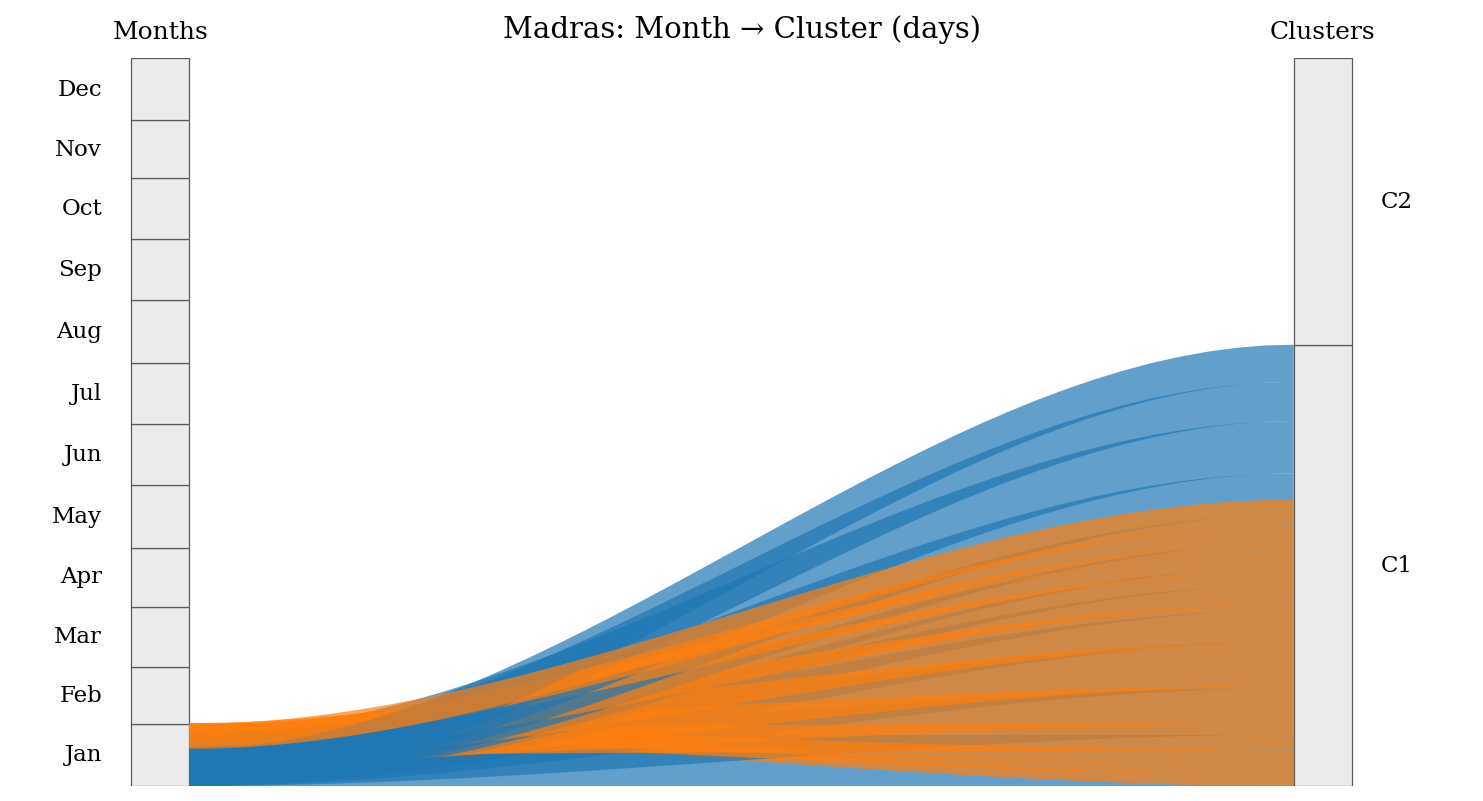
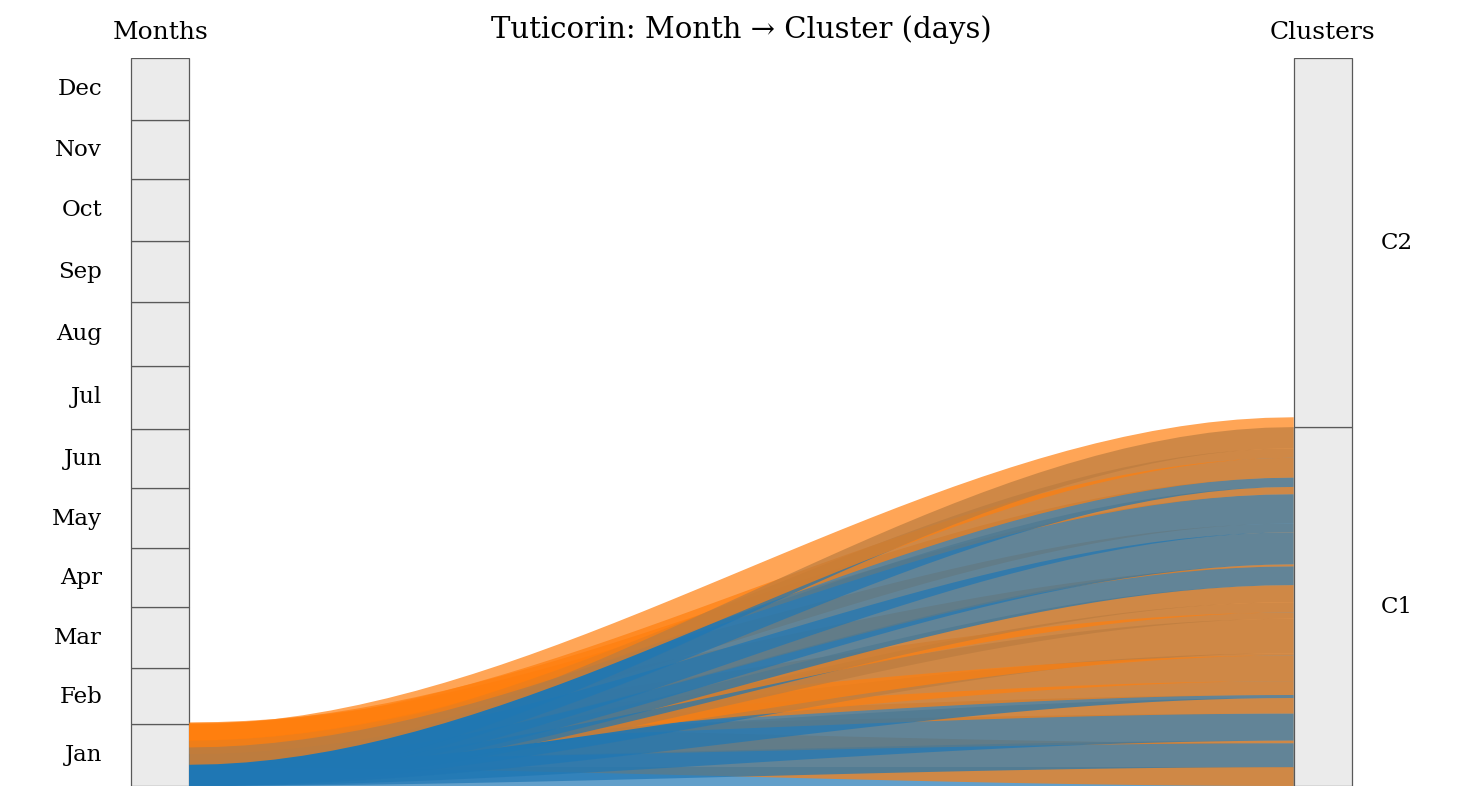
PCA, t-SNE, and UMAP-based clustering to identify similar wind patterns across different wind farm sites.
⚙️ Optimized Scheduling
Risk-controlled maintenance window recommendations based on low wind power density periods.
🇮🇳 India-Specific Data
Tailored for Indian wind farm locations across Maharashtra, Tamil Nadu, Gujarat, Karnataka, Rajasthan, and Andhra Pradesh.
🔮 Predictive Analytics
Weibull distribution and Markov model-based forecasting for proactive maintenance planning.
🎯 Problem Statement
📸 Gallery Preview
Browse through 60 high-quality visualizations including heat maps, contour plots, clustering diagrams, Sankey flows, and more.
View Complete Gallery (60 images) →
🚀 Quick Start
# Clone the repository
git clone https://github.com/Samsomyajit/windpulse.git
cd windpulse

# Install dependencies
pip install -r requirements.txt
🛠️ Technology Stack
📄 License
This project is licensed under the Apache License 2.0.
For questions or collaboration, please open an issue on GitHub.